by CalculatedRisk on 8/20/2009 11:21:00 AM
On the MBA conference call concerning the “Q2 2009 National Delinquency Survey”, MBA Chief Economist Jay Brinkmann said this morning:
Note: The MBA data shows about 5.8 million loans delinquent or in the foreclosure process nationwide. I believe the MBA surveys covers close to 90% of the mortgage market. Many of these loans will cure, but the foreclosure pipeline is still building.
A few graphs …
 Click on graph for larger image in new window.
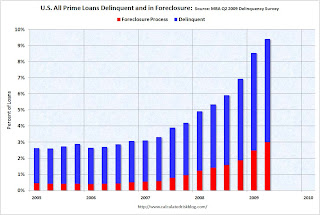
The first graph shows the delinquency and in foreclosure rates for all prime loans.
Prime loans account for all 78% of all loans.
“We’re all subprime now!” NOTE: Tanta first wrote this saying in 2007 in response to the ‘contained to subprime’ statements.
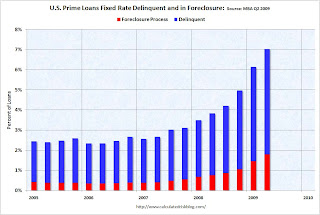
 The second graph shows just fixed rate prime loans (about 65.5% of all loans).
Prime ARMs have a higher delinquency rate than Prime FRMs, but the foreclosure crisis has now spread to Prime fixed rate loans.
Note that even in the best of times (with rapidly rising home prices in 2005), just over 2% of prime FRMs were delinquent or in foreclosure. However the cure rate was much higher back then since a delinquent homeowner could just sell their home.
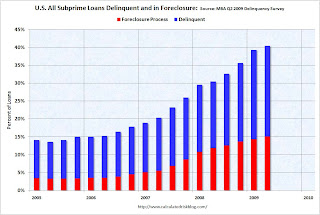
 The third graph shows the delinquency and in foreclosure process rates for subprime loans.
Although the increases have slowed, about 40% of subprime loans are delinquent or in foreclosure.
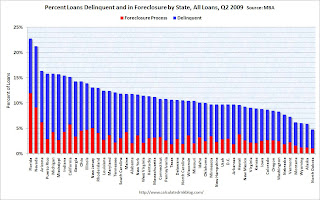
The fourth graph shows the delinquency and foreclosure rates by state (add: and D.C. and Puerto Rico!).
 The ‘in foreclosure’ rate can vary widely by state, because the process is fairly quick in some states, and very slow in other states (like Florida).
Although most of the delinquencies are in a few states – because of a combination of high delinquency rates and large populations – the crisis is widespread.
And a final comment: historically house prices do not bottom until after foreclosure activity peaks in a certain area. Since the subprime crisis delinquency rates might be peaking, it would not be surprising if prices are near a bottom in the low end areas. But in general I’d expect further declines in house prices – especially in mid-to-high end areas.