While recent government incentives resulted in a temporary increase in existing home prices, closer examination of existing trends and data indicates that new construction and existing home prices continue to remain at near early 2009 lows. With high employment and an uncertain shadow inventory of homes already foreclosed on, or in the midst of foreclosure, downward pressure on home prices is likely to continue, especially in the new construction sector. For more on this, see the following article from The Street.
The recent existing-home sales data from the National Association of Realtors showed a continuing downtrend in home prices. The same day, the S&P Case-Shiller Housing Index was released, with data through August.
Prices continued an uptrend that started in April. Is this the leading indicator that shows the housing market will recover?
One day after Case-Shiller, the U.S. Census Bureau new-homes data for September was released. The number making the most headlines was the unexpectedly low number of new-home sales of 402,000. This was well below both the number for August (417,000) and the expected number for September, north of 420,000.
However, more importantly, but not receiving as much attention, the price of new homes continued to decline. The headline for median price was a monthly increase of 2.4% to $204,800. That is very misleading. The August median price was unusually low, dropping 9.5% from July, an all-time one month record.
The September median new-home price was 5% below July, and 9.1% lower than one year ago. If anything, the decline in the median price is accelerating, with more than half of the decline for the past year coming in the last two months. This is a noisy number, however, and inferring that price declines are accelerating based on two months of data isn’t justified.
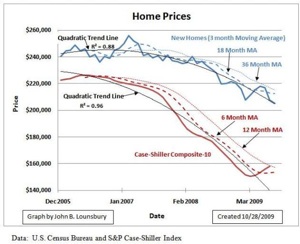
The following graph shows the recent median price history for both the Case-Shiller Composite-10 Index and the Census Bureau new-homes survey. To smooth the new-homes data noise, a three-month moving average is plotted.

The quadratic trend lines fit the data very well (R2 values close to 1.0). The Case-Shiller curve has crossed the six-month moving average and is sitting right at the 12-month monthly average. This is a possible upturn signal.
The new-homes price curve, on the other hand, is well below the two moving averages and is sitting right on the trend line. This is giving no evidence of an upturn, contrary to the headline of +2.4% August to September.
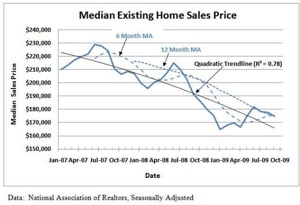
The same graph is shown below for last week’s NAR existing-homes sales data, again for September.
The R2 value is less than in the previous graph, but still large enough to indicate the trend line is a fair representation of the data. For the NAR existing-home sales, the data has been above the trend line for four months, but has been following the downsloping 12-month moving average. It is now also at the upsloping six-month moving average. Chart readers will say, “The next two months will be time to fish or cut bait.”

So the charts are indicating 1) new-home prices are declining; 2) as of the end of August (Case-Shiller) existing-home prices are rising; and 3) at the end of September (NAR) existing-home prices are at a point at which the next one or two months will confirm a possible breakout to higher prices or show a continued decline.
James R. Hagerty of WSJ Blogs reports that, according to a paper by Goldman Sachs, federal and state government actions to encourage mortgage modifications and delay foreclosures, as well as the $8,000 first-time homebuyer tax credit, have added about 5% to current home prices.
If this estimate is applied to current numbers, the NAR median price drops to $166,000, very close to the $164,800 low in January. For the Case-Shiller median price, it would be reduced to $150,000, virtually the same as the low for that index in April ($150,300). In other words, without the temporary effects from government actions, house prices would be at their lows from earlier this year right now.
Other headwinds facing the housing market come from three sources:
- High unemployment
- An uncertain shadow inventory of homes already foreclosed but not yet on the market, in the foreclosure process, or delinquent by more than one year
- A significant number of further foreclosures possible in 2010-12
The second and third items are probably larger than the first. David Rosenberg, chief economist for Gluskin Sheff, has estimated the shadow inventory to be about 7 million homes right now. There is a wide range of estimates, like the Housing Predictor homeowner survey, of how many future foreclosures are possible, all the way up to 25 million.
The conclusion: The Case-Shiller index data for August indicates nothing more than a temporary blip in prices resulting from government programs. With home prices already below construction costs and likely to head lower, avoid homebuilders like Toll Brothers(TOL Quote), D.R. Horton (DHI Quote), Hovnavian(HOV Quote), Pulte Homes (PHM Quote), KB Home (KBH Quote) and Lennar(LEN Quote).